- En
- Fr
- عربي
The Importance of Reacting to and Understanding the 2007-08 Financial Crisis: Facts and Suggestions
Abstract
This paper summarizes and explains the main events of the financial crisis in 2007-08. Starting with the main conditions that led up to the crisis, we explain the details and specificities of each condition and analyze the snowball mechanisms that amplified losses in the mortgage market into turmoil in financial markets. We also suggest few policies that we think important to avoid a repeat of the crisis.
Keywords:
Financial crisis, subprime mortgage crisis, securitization, shadow banking, SPV, CDOs, RMBS, CDS, ABX.
Introduction
Understanding the causes of the financial crisis is vital to avoid another crisis of this magnitude. It is also important for restoring stability and building a strong new financial system. While almost all international organizations([1]) mainly the IMF([2]), failed in providing adequate warnings prior to the crisis, the investigation is likely to continue for many years. Financial regulators refused to see the risk concentrations and flawed incentives behind the financial “modernization” boom. Policymakers failed to consider rising macroeconomic imbalances. At the international level, effective policy cooperation was never achieved. Central banks focused mainly on inflation, not on risks related to extremely high asset prices and consequently unmanageable increased leverage. Financial supervisors were in a deep coma, only preoccupied with the formal banking sector, not with the risks building in the staggering shadow financial([3]) system. The banking system was metamorphosing into an off-balance sheet and derivatives world. The traditional banking system is no longer as central to the savings-investment process as it was. The strategy of off-balance-sheet vehicles - investing in long-term assets and borrowing with short-term paper - exposes the banks to funding liquidity risk: if investors suddenly stop buying asset-backed commercial paper, they prevent these vehicles from rolling over their short-term debt. In this case, the sponsoring bank grants a credit line to the vehicles, called a -liquidity backstop. In summary, the banking system still bears the liquidity risk from holding long-term assets and making short-term loans even if it does not appear on the banks‘ balance sheets. Commercial and investment banks were heavily exposed to maturity mismatch both through granting liquidity backstops to their off-balance sheet vehicles and through their increased reliance on repo([4]) financing. The reduction in funding liquidity led to significant stress for the financial system starting the summer of 2007.
Since that time, financial markets and financial institutions all over the world have been hit by catastrophic developments that had started earlier in 2007 with problems in the U.S. subprime mortgage market, extended to corporate credit markets at the end of 2007, and to other countries in the fall of 2008. Financial institutions have written off losses worth many billions of dollars, Euros or Swiss francs, and are continuing to do so. Liquidity has virtually disappeared from important markets. Stock markets have plunged. Central banks have provided support on the order of hundreds of billions, intervening not only to support the markets but also to prevent the breakdown of individual institutions. The effects of the crisis on real activity appeared to be limited at first, but this did not last. Rising loan losses led to very high credit risks. The flight from risky assets and illiquid market conditions has increased funding costs despite a decline in risk-free rates with monetary easing.
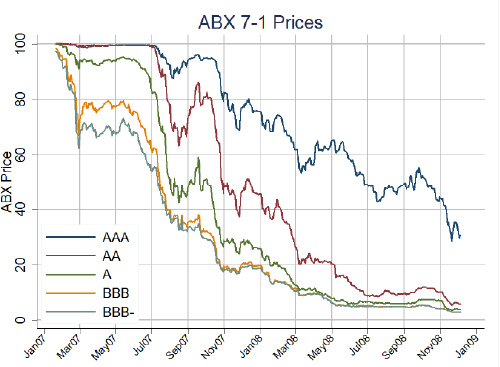
The trigger for the liquidity crisis was an increase in subprime mortgage defaults, first noted in February 2007. Figure 1 illustrates the ABX price index, which is based on the price of credit default swaps. As this price index declines, the cost of insuring a basket of mortgages of a certain rating against default increases. This review led to a deterioration of the prices of all mortgage-related products.
Figure 1: Decline in Mortgage Credit Default Swap ABX Indices ([5])
Source: LehmanLive
The first illiquidity wave on the interbank market started on August 2007. The default and liquidity risks of banks rose significantly, which put upward pressure on the LIBOR. The interbank market froze on August 9 which led the European Central Bank([6]) and the U.S. Federal Reserve([7]) to inject billion of dollars.
Systemic concerns for insurance companies and pension funds became serious since January 2008. Insurance companies’ exposure to assets whose quality is deteriorating was significant. To offset the series of write-downs, banks have managed to obtain capital thanks to the massive public sector injections. Expected losses continue to mount. The IMF estimates for projected write-downs during 2009 and 2010, would result in a net capital shortfall in the order of magnitude of at least half a trillion dollars([8]).
The purpose of this paper is to identify the basic mechanisms that have taken us where we are today, and to suggest and think about policies that the major economies need to implement, now and later. We will also try to explain how a limited and localized loan crisis in the United States could have such incredible effects on the world economy whereas a large increase in oil prices from the early 2000s to mid-2008 had a small impact on economic activity (Naimy V. (2008)). We will make sure throughout this paper to properly answer these questions while providing exhaustive definition of major terms such as the subprime mortgages, Collateralized Debt Obligations, CDOs, Residential Mortgage Backed Securities, RMBs, Credit Default Swaps, CDS, etc.
I- Initial Conditions That Generated the Crisis
The crisis started with the decline in housing prices in the U.S. Hundreds of explanations and reasons are possible to explain this fact. However, we categorize them as fourfold:
1. The underestimation of risk inherent in newly issued assets;
2. The opacity of the derived securities on the balance sheets of financial institutions;
3. The connectedness between financial institutions within and across countries;
4. The very high leverage.
1. Underestimation of Risk
In this section, we will try to explain in details the reasons and origination of the risk inherent to the subprime market. That would basically clarify half of the causes of the crisis.
a. Subprime Mortgages
Subprime([9]) mortgages are a financial innovation designed to provide home ownership opportunities to riskier borrowers in the U.S. Home ownership for low income and minority households has been a long-standing national goal in the U.S. These borrowers are riskier because they have the following problems:
- insufficient funds for a down payment;
- credit issues, either no credit history or prior problems related to debts repaying;
- inability to document income;
- lack of information or incorrect information.
If mortgages were to be extended to these borrowers, the underwriting standards would have to be different, and the structure of the mortgages would have to be different. For full details see Listokin et al. (2000). Therefore, lending to this group involved a particular mortgage design feature. The innovation was booming and successful during the period 2000-2007. The outstanding amounts of Subprime and Alt-A([10]) combined amounted to about one quarter of the $6 trillion mortgage market in 2005-2007Q1. Over the period 2000-2007, the outstanding amount of agency mortgages doubled, but subprime grew 800%! Issuance in 2005 and 2006 of Subprime and Alt-A mortgages was almost 30 percent of the mortgage market([11]).
The mortgage was designed in a curious fashion: lenders planned the loan to make lending to riskier borrowers (as previously described) promising and profitable. That resulted in linking the outcome to house price appreciation over short periods. The horizon is implicitly intended to be short to reduce and protect the lender’s exposure. Conditional on no housing price decline, the mortgage is rolled into another mortgage with the same condition of a short horizon as well. Therefore, most subprime mortgages appeared relatively riskless and the appreciation of the house can become the basis for refinancing every two or three years.
b. Characteristics of the Subprime Mortgages
Fixed vs Floating Interest Rates:
Subprime mortgages are adjustable-rate mortgages (ARMs) with 30-year amortizations, and a variation of a hybrid structure:
- 2/28 ARM: the “2” represents the number of initial years over which the mortgage rate remains fixed, while the “28” represents the number of years the interest rate paid on the mortgage will be floating.
- 3/27 ARM: the “3” represents the number of initial years over which the mortgage rate remains fixed, while the “27” represents the number of years the interest rate paid on the mortgage will be floating.
- The initial monthly payment is based on a “teaser” interest rate that is fixed for the first two years (for the 2/28) or three years (for the 3/27) which basically makes refinancing important at the end of this short period.
Margin or Premium:
The margin that is charged over the reference rate depends on the borrower's credit risk as well as prevailing market margins for other borrowers with similar credit risks.
Reset Rate:
After the initial period (two years or three) comes the rate “reset” (or step-up date) i.e., when the rate becomes variable and higher. The reset rate is significantly higher creating a strong incentive to refinance.
Cap Rate:
The interest rate is updated every six months, subject to limits or cap rates:
- periodic cap: a limit rate on each subsequent adjustment above which the rate cannot increase;
- life time cap: a limit cap interest over the life of the loan.
Prepayment Penalties:
Fannie Mae estimates that 80 percent of subprime mortgages have prepayment penalties, while only two percent of prime mortgages have prepayment penalties. This has obviously created an incentive not to refinance early.
If the prepayment and step-up rate penalty are sufficiently high the borrower will default unless refinancing is allocated from the lender. In this case, the lender is practically the decision maker: the lender has a “roll over” option at the end of the teaser or fixed-rate period. During the period 1998 – 2006, house prices rose and prepayment speeds were high. Almost half of the mortgages of all types were refinanced within five years (Bhardwaj and Sengupta (2008)).
Refinancing Option:
Refinancing means that the borrower could be rolled into another subprime loan([12]). As house prices rise, the lender is in a position to grant the borrower a sequence of subprime loans and has also the right to opt out by not refinancing and cashing the recovery amount. The borrower can always refinance at the reset date with any originator, however, the mortgage market is limited with respect to refinancing and borrowers find themselves tied up to their initial mortgage originator.
c. The Risk
Subprime mortgages appeared relatively riskless when prices did not decline. In fact, the value of the mortgage might be high relative to the price of the house, but it would slowly decline over time as prices increase. In retrospect, the misleading notion of the proposition was in its assertion: when housing prices actually declined, mortgages exceeded the value of the house. This led to defaults and foreclosures.
2. The Opacity of the Derived Securities
Most of subprime mortgages are financed via securitization. Securitization led to opacity which made the valuation of assets on the balance sheet complex and hard.
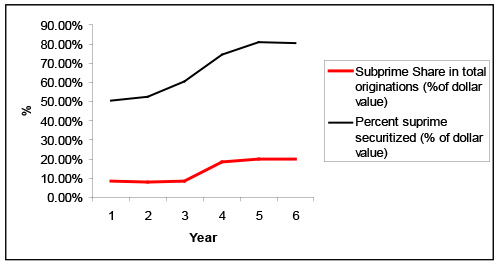
Table 1 shows the quantitative importance of subprime securitizations and how much subprime lenders depended on securitization for the financing of their mortgages. In 2005 and 2006 originations were about $1.2 trillion of which 80 percent was securitized.
Table 1: Subprime Securitization
|
Year |
Total Mortgage Originations (Billions) |
Subprime Originations (Billions) |
Subprime Share in Total Originations (% of dollar value) |
Subprime Mortgage Backed Securities (Billions) |
Percent Subprime Securitized (% of dollar value) |
|---|---|---|---|---|---|
|
2001 |
$2 ,215 |
$190 |
8.6% |
$95 |
50.4% |
|
2002 |
$2,885 |
$231 |
8.0% |
$121 |
52.7% |
|
2003 |
$3,945 |
$335 |
8.5% |
$202 |
60.5% |
|
2004 |
$2,920 |
$540 |
18.5% |
$401 |
74.3% |
|
2005 |
$3,120 |
$625 |
20.0% |
$507 |
81.2% |
|
2006 |
$2,980 |
$600 |
20.1% |
$483 |
80.5% |
Sources: The 2007 Mortgage Market Statistical Annual.
Figure 2: Subprime Share Vs Percent Securitized
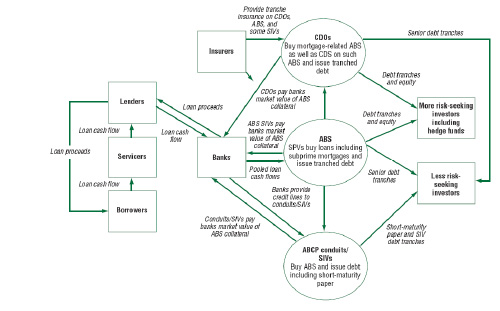
Mortgages were pooled to form mortgage-based securities (MBS), and the income streams from these securities were separated or tranched further to offer more or less risky flows to investors. Subprime securitization tranches were sold into Collateralized Debt Obligations([13]), CDOs. Tranches of CDOs were, in turn, often purchased by market value off-balance sheet vehicles, and money market mutual funds. Additional subprime risk was created with derivatives. Figure 3, taken from the 2007 IMF Global Financial Stability Report([14]) (GFSR) illustrates the complexity of the financing arrangements.
Figure 3: Mortgage Market Flows and Risk Exposures
a. Overview of Securitization
Securitization is one of the more visible forms of the use of off-balance sheet Special Purpose Vehicles SPVs. Securitization uses qualified SPVs and entails selling rated securities in the capital markets.
SPV
A special purpose vehicle or special purpose entity is a legal entity which has been set up for a specific, limited purpose by another entity, the sponsoring firm. An SPV can take the form of a corporation, trust, partnership, or a limited liability company. The SPV may be a subsidiary of the sponsoring firm, or it may be an “orphan” SPV, one that is not consolidated with the sponsoring firm for tax, accounting, or legal purposes([15]). Most commonly in securitization, the SPV takes the legal form of a trust.
The transfer of receivables from the sponsor to the SPV is treated as a sale (off-balance sheet) not as a loan provided the SPV is a “qualifying SPV([16]),” and the sponsor surrenders control of the receivables([17]).
An essential feature of an SPV is that it be bankruptcy remote. This means that should the sponsoring firm enter a bankruptcy procedure, the firm’s creditors cannot seize the assets of the SPV. It also means that the SPV itself can never become legally bankrupt. Because the SPV’s business activities are constrained and its ability to incur debt is limited, it faces the risk of a shortfall of cash below what it is obligated to pay investors. This chance is minimized via credit enhancement.
Credit Enhancement
The most important form of credit enhancement occurs via tranching of the risk of loss due to default of the underlying borrowers. Tranching takes the form of a capital structure for the SPV with:
- “A” notes and “B” notes which are senior rated tranches sold to investors in the capital markets,
- “C” note or junior security, typically privately placed,
- other forms of equity-like claims,
- over-collateralization, securities backed by a letter of credit, or a surety bond, or a tranche may be guaranteed by a monoline([18]) insurance company.
The Use of Off-Balance Sheet Financing
By definition, off-balance sheet financing is excluded from the sponsor’s financial statement balance sheet, and so it is not reported systematically. Therefore, it is hard to determine how wide the use of SPVs has become. Qualified off-balance sheet SPVs that are used for asset securitization usually issue publicly rated debt and data is available about these vehicles.
Securitization
The securitization process consists of the following four steps:
- a sponsor or originator of receivables sets up the bankruptcy-remote SPV, pools the receivables, and transfers them to the SPV as a “true sale”;
- the cash flows are tranched into asset-backed securities, the most senior of which are rated and issued in the market; the proceeds are used to purchase the receivables from the sponsor;
- the pool revolves in that over a period of time the principal received on the underlying receivables is used to purchase new receivables;
- there is a final amortization period, during which all payments received from the receivables are used to pay down tranche principal amounts.
The maturity of the SPV debt is determined arbitrarily([19]).
b. Complexity Generates Opacity
As previously explained securitization was and still is a major development in risk allocation. Theoretically, with securitization, any price fluctuations would be fairly amortized by the economy simply because the shock will be absorbed by a large set of investors rather than just by a few financial institutions. However, we should not underestimate the complex process of securitization: with complexity, came opacity. If assessing the value of a simple mortgage pools (the MBS) was possible, it was harder to assess the value of the derived tranched securities (the CDOs), and quite impossible to assess the value of the derived securities resulting from tranches of derived securities (the CDO2s) Figure 6 below clearly illustrates the scheme of CDOs. In such uncertain environment, a large number of financial institutions’ balance sheets have been severely affected.
In this part of the analysis, we will try to illustrate through simple figures and explanation the securitization complexity of subprime mortgages.
Subprime Residential Mortgage Backed Securities, RMBS
The securitization of subprime mortgages is different from traditional securitization mainly because the underlying mortgages are expected to refinance after two or three years (see the above section 1.B). Consequently, there will be an early inflow of cash within the securitization transaction. This cash will be allocated in various ways within the securitization transaction. The credit enhancement will depend on the expected incoming cash. Further, the inherent risk in this process depends on the refinancing of the mortgages, which in turn depends on house prices.
Subprime Residential Mortgage Backed Securities bonds of a given transaction vary by seniority similarly to other securitization, unlike the amounts of credit enhancement for each tranche and the size of each tranche that rely on the cash flow coming into the deal in a considerable way. This cash flow is highly correlated to the underlying mortgages’ prepayment. As previously discussed, the cash coming into the deal depends on triggers. Triggers([20]), when applicable, can switch cash flows within the preset structure which in turn can lead to a leakage of safety for higher rated tranches. Figure 4 shows the structure of a subprime RMBS transaction.
Figure 4: Basic Structure of a Subprime RMBS Transaction
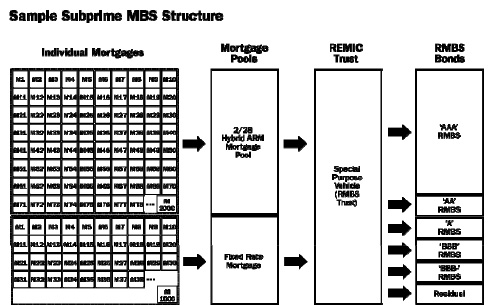
Source: Kevin Kendra, Fitch, “Tranche ABX and Basis Risk in Subprime RMBS Structured Portfolios,” Feb. 20, 2007.
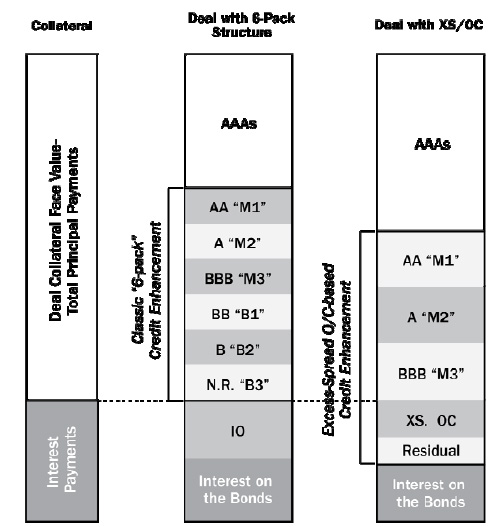
Asset-backed securities (ABS) and mortgage-backed securities (MBS) utilize the following structures:
- “senior/sub” or the “6-pack” which consists of a senior/subordinate shifting of interest structure: there are 3 mezzanine bonds and 3 subordinate bonds junior to the AAA bonds, and/or
- “XS/OC” called excess spread/overcollateralization([21]) structure.
Figure 5 below displays the two types of transaction structures:
Figure 5: Senior/Sub and OC Structures
Source: UBS
The above illustrated transactions are quite complicated. We will not discuss in this paper the XS/OC structures. For more details, see Naimy V., 1999.
Collateralized Debt Obligations (CDOs)
The next link in the chain is collateralized debt obligations (CDOs). A cash CDO is a special purpose vehicle. It buys a portfolio of fixed income assets, and finances the purchase by issuing different tranches of risk in the capital markets. These tranches are rated as follow:
- senior tranches, rated Aaa/AAA,
- mezzanine tranches, rated Aa/AA to Ba/BB, and
- equity tranches (unrated).
CDO portfolios consist of significant amounts of tranches of subprime and Alt-A contracts. Figure 6 shows the interrelation of subprime mortgages, the subprime RMBS and the CDOs. The BBB bonds from the RMBS deal go into a “Mezzanie CDO”, as illustrated below, because the portfolio is constituted of BBB rated ABS and RMBS tranches. If bonds issued by Mezz CDOs are sent into another CDO portfolio, then the new CDO – now holding Mezz CDO tranches—is called a “CDO squared” or “CDO2.”
Figure 6: Subprime mortgages Vs the Subprime RMBS and CDOs
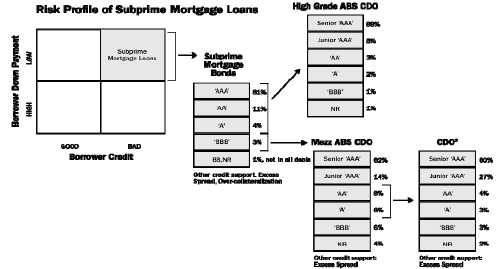
Source: UBS, “Market Commentary,” December 13, 2007
Each ABS CDO must be separately modeled. This played an important role in the panic when investors attempt a valuation of CDO tranches and failed their task. Given the lower-rated tranches and the difficulties faced in selling the BBB tranches of subprime RMBS, we wonder why would CDOs buy subprime RMBS bonds?
As for the higher rated tranches, CDOs are encouraged to buy large amounts of structured assets. This is justified by the fact that AAA tranches would be considered as strong support for profitable negative basis trades. A negative basis trade is when a bank buys the AAA-rated CDO tranche and simultaneously purchases protection on the tranche under a physically settled credit default swap (CDS)([22]). In other terms, the bank could book the net present value of the excess yield on the CDO tranche over the protection payment on the CDS. If the CDS spread is less than the bond spread, the basis is negative([23]). In this case, a negative basis trade switches the risk of the AAA tranche to a CDS writer.
Synthetic Subprime Risk
Subprime risk can be traded synthetically with credit derivatives([24]) in the OTC market. Consequently, the risk is not created on net simply because we are dealing with derivatives. Further, the longs and shorts are not identifiable. “Synthetic CDOs” are CDOs with entirely synthetic portfolios. The portfolio of a “hybrid CDO” consists of a both cash positions and CDS. Synthetic CDOs, relying completely on derivatives became increasingly important.
To summarize, the subprime mortgages have been securitized and tranches of these securitizations have been sold to CDOs, and tranches of the CDOs have been sold to investors. Additional subprime risk has been traded via derivatives.
3. The Connectedness Between Financial Institutions Within And Across Countries
An important question is to be asked: where did the CDO tranches go? Simply we don’t know. Tranches of CDOs have been purchased by investors from all around the world: securitization increased connectedness across financial institutions while globalization increased connectedness of these institutions across countries. Foreign claims by banks from France, Germany, Japan, United Kingdom and the United States witnessed an increase from $6.3 trillion in 2000 to $22 trillion by June 2008. In mid-2008, claims on emerging market countries exceeded $4 trillion. Those banks decided to cut on their foreign exposure and of course the consequences expanded and deepened the crisis.
House price declines and the panic started. It was impossible to identify the effect of the price deterioration on the value of these bonds and structures. Between 2001 and 2005 the value of houses witnessed an average increase of 54.4 percent([25]). In August 2007 price changes were stable and starting September 2007 house price appreciation has been negative (see below figure).
Figure 7: Lagging Two-Year House Price changes (%)
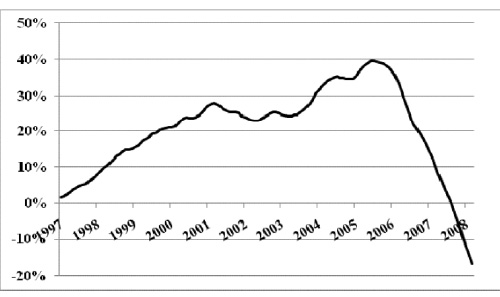
Source: S&P
After this negative change in house prices, the ability of subprime and Alt-A borrowers to refinance has been drastically reduced. At the same time, lenders went into bankruptcy, meaning that the mortgage market for these borrowers to refinance has effectively closed and is expected to completely shut down.
4. The High Leverage of The Financial System As A Whole
With reference to what has been exposed and explained especially regarding the underestimation of risk, we conclude that financial institutions financed their portfolios with less and less capital, hence increasing the rate of return on that capital. Further, the holes in regulations encouraged these institutions to increase their leverage: they were allowed to reduce capital requirements simply by shifting assets([26]) off their balance sheets through SIVs. This problem was spread out to include insurance companies as well. The assets value became uncertain and even lower, therefore the probability of capital deterioration becomes higher and higher only to lead financial institutions to become insolvent. This is exactly what we have witnessed.
The Snowball and the Spread Out Mechanism
When the value of capital becomes lower and uncertain the probability of insolvency increases. In this case, depositors and investors are expected to take their funds out of the institutions at risk. However, depositors are now largely insured and these risky institutions were not able to finance themselves through the money market and found themselves in front the fait accompli: selling their assets. Given the opacity in the value of assets, investors were incapable to assess, reluctant to buy assets and therefore assets were sold at the “fire sale prices” or knockdown prices([27]). The sale of the assets by one institution contributed to a decrease in the value of all similar assets, not only on the balance sheet of the institution which is selling, but on the balance sheets of all the institutions which hold these assets. This has in turn squeezed their capital which obliged them to sell more assets, and so on. It is important to mention that securitization expanded the exposure of a larger set of institutions to the leverage risk (having less capital relative to assets).
Instead of selling assets, a financial institution may opt to cut credit to another financial institution. The latter may in turn be forced to sell assets. Undeniably, this is how the crisis moved from advanced countries to emerging market countries:
- Financial institutions in developed countries cut the credit lines to their foreign subsidiaries.
- Foreign subsidiaries were in turn forced to sell assets and cut credit to domestic borrowers.
- And the circle continued.
Consequences of the Snowball Mechanism
- Contamination across institutions and countries: the crisis started with subprime mortgages in early 2007, extended to financial institutions and money markets([28]), to regular mortgage pools (Prime Residential Mortgage Backed Securities), corporate credit at the end of 2007, and to emerging markets in Fall 2008.
- Counterparty risk: the crisis led to an increase in counterparty risk between banks([29]). This was accompanied by a decrease in the maturity of the loans that banks were willing to make to each other.
- Credit rationing: the crisis led also to a severe tightening of the lending standards.
- Full economic crisis: lower housing prices, higher leverage, fire sales prices, decreased stock market value, lower stock prices, higher risk premia, and credit rationing led to a serous worry that the crisis might lead to another Great Depression. This was translated to a dramatic fall in consumer and firm confidence worldwide.
II- Facing the Crisis
Any policy that should be applied whether on the short or long run should take into consideration two major objectives:
- Stop the snowball effect
- Avoid a repeat of the crisis
1. Stop the Snowball Effect
The focus will be in the following analysis on the financial side.
Lending Money
Because financial institutions are facing liquidity problems and in order for these institutions to stop selling their assets at the fire sale prices, they need to be immediately financed against acceptable amount and quality of collateral. This is what central banks indeed did: they acted as lenders of last resort and widened the list of assets that qualify as collateral for these institutions.
For domestic institutions this policy was relatively efficient, but that was not the case for countries suffering from severe outflows. For example in Iceland, where the banking system is very large relative to its economy, and where deposits and loans were mainly denominated in euro, the central bank was not able to save the situation and stop the runs. Financial institutions faced liquidity asphyxia because they were unable to borrow in the money markets especially that Iceland is not a part of the Euro circle and was in bad need for foreign liquidity. The three larger Icelandic banks went bankrupt which engendered a tough crisis.
Assets Purchases
In addition to the liquidity problems faced by the financial institutions, we add the deterioration of their capital ratios. To this end, the financial authorities could help in taking the following actions:
- Buying the bad and doubtful assets at a floor value in exchange for shares for example in the institutions while keeping these assets on the balance sheet.
- Buying these assets in exchange for cash or TBs while moving these assets off the balance sheet. Of course the determination of the selling price could be made using plenty of scenarios.
This could eventually:
- Reduce uncertainty and opacity and make the value of assets clear and transparent,
- Allow investors to better assess the risk,
- Stop the sale of assets at the fire sale prices,
- Improve the balance sheet figures and capital ratios,
- Reduce the credit rationing.
Of course, one can expect to witness some institutions to be insolvent and thus going bankrupt. However, other institutions could recover and go through a healthy recapitalization process and put a stop to the snowball mechanism.
Where Are We Today?
In October 2008, the United States introduced the “troubled asset relief program” (TARP), allowing the Treasury to buy assets or inject capital up to $700 billion. Later, major countries agreed to put in place financial programs similar to that in the US([30]). Many governments are still exploring their ways and even changing directions([31]) upon the needs of the day.
Other measures are required to increase demand especially after the sharp fall in output since 2008 up till now. A traditional use of monetary policy might fail. The main objective is to reduce spreads in dysfunctional credit markets via an original government intervention. As suggested by the IMF, developing new fiscal packages aiming at directly increasing the demand is fundamental.
Avoid a Repeat of the Crisis
The global financial system appeared fragile and vulnerable.
The question is to establish balance between strengthening this system without slowing down its productivity. Much suggestions and solutions have been proposed. Our purpose is not to repeat what has been recommended by academicians and international institutions. We simply wish to come out with an added value with respect to what have been wisely thought in terms of policies covering:
- Restrictions on executive compensation,
- Rules for valuing assets on balance sheets,
- Creation of regulatory capital ratios,
- Examination of rules governing ratings agencies,
- And so on..
To this end, it is important to consider the four initial crisis triggers previously analyzed in order to value how to avoid recreating similar conditions in the future.
There is no doubt that some of the causes that generated the crisis cannot be eliminated. This is the case of securitization and thus the so called complex derivative securities. Securitization remains one of the best instruments used for a better risk allocation and reduction. The problem is to prevent all the complexity related to the design and conception of these instruments from becoming opaque, not to abolish securitization. There is much better to do in the future to maintain a minimum degree of transparency and avoid ambiguity whether in pricing or issuing.
The second trail where much work can be done concerns the very high leverage of both, the economy and the financial system. The leverage was already above its accepted cap levels well before the crisis. Regulation should force lower leverage. Forcing regulation implies first of all extending the borders of regulation beyond banks and make it solid, tough, coherent, and applicable on all types of financial structures. Coherence is fundamental to establish homogeneity and significance: for example almost all existing tax rules indirectly encourage such leverage through tax deductibility of highly levered firms([32]) and households([33]). Even if regulation could never be perfect, rules should be radically reviewed and structured in a consistent fashion in order to:
- Monitor the risk; as conferred about in the first section, one of the major triggers of the crisis was the underestimation of risk due to serious lack in the risk monitoring.
- Better collect information that will lead to a better measurement([34]) of the systemic risk while keeping in mind that systemic risk can never be fully under control and remains quite difficult to evaluate and quantify.
- Vigorously react when indicators of systemic risk increases. The challenge is in the definition of the “how’ to react. We don’t pretend having the expertise to delineate the “how” in this paper.
- Actively use of the monetary policy: the monetary policy is not limited to fight asset price or credit booms.
Discussion and Conclusion
This paper summarizes how the financial crisis affects the balance sheets of financial institutions, corporates, and households and therefore distresses the availability of credit which negatively influenced the performance of the real economy. The credit squeeze emerged as a consequence of the financial institutions insolvency that has been magnified by the interconnectedness of large banks and by the funding illiquidity that started in 2007 with the subprime crisis. Further, uncontrollable rapid financial innovation contributed to an incredible high leverage. Both regulation and market discipline failed to restrain that risk. Financial regulators were not equipped to see the risk concentrations and flawed incentives behind the financial innovation boom. Financial supervisors were preoccupied with the formal banking sector, not with the risks building in the shadow financial system. The traditional banking model, according to which the banks hold loans until they are repaid, was replaced by the - originate and distribute - banking model which led to a decline in the lending standards.
The spreading rhythm of the financial crisis advanced faster in 2009 than expected. This has led to an exceptional contraction in global demand, output and trade. In fact, interactions between macroeconomic and financial variables led to the current severe recession. We believe that this recession tends to be deeper and longer than other recessions because it took place alongside simultaneous assets price deterioration and credit crunches. These were passed on through banking systems to all sectors and countries and were transmitted by the collapse of consumer and business confidence. Figure 8 shows the IMF growth forecasts. Most advanced countries now have negative growth, and the forecasts are for negative growth in 2009 as well. Emerging market countries are forecast to have positive growth, but much lower than they have had in the past.
Figure 8: Expected GDP Growth in (%)
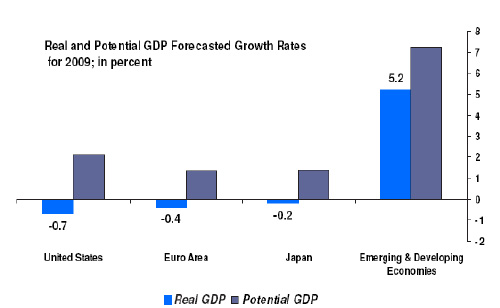
The monetary policy that used to fight asset price or credit crunches appears weaker and less efficient during this recession. The traditional monetary policy theory looks old and controversial. Fiscal stimulus seems helpful provided that public debt is not too high. Fiscal measures should aim at increasing demand and restoring confidence on the one hand and at repairing the financial system on the other hand.
This paper is written during the crisis. As we write it, the crisis appears to be entering yet a new phase. This, raises a set of new issues may be not discussed or analyzed in this study. I am afraid I will have to draft again, next year, another study for an update...
References
- Adrian, T. and Brunnermeier, M. K. (2008), CoVaR‘, working paper. At <http://www.princeton.edu/~markus /research/papers/CoVaR>
- Allen, F., and E. Carletti (2008), “Mark-to-Market Accounting and Cash-in-the-Market Pricing”, Journal of Accounting and Economics 45, 358 – 378.
- Berman, Dennis K. (2007), “Sketchy Loans Abound with Capital Plentiful, Debt Buyers Take Subprime-Type Risk”, Wall Street Journal. March 27, page C1.
- Bernanke, B. and Gertler, M. (1989), “Agency Costs, Net Worth, and Business Fluctuations”, American Economic Review 79 (1), 14-31.
- Bernanke, B., Gertler, M. and Gilchrist, S. G. (1996), “The financial accelerator and the flight to quality”, Review of Economics and Statistics 78 (1), 1–15.
- Bernanke, B.S. (2008), Mortgage Delinquencies and Foreclosures, Speech at the Columbia Business School 32nd Annual Dinner. At http://www.federalreserve.gov/newsevents /speech/Bernanke20080505a.htm
- Bhardwaj, G. and Sengupta, R., (2008), “Prepaying Subprime Mortgages”, Working Paper, Federal Reserve Bank of St. Louis.
- Caballero, R. J. and Krishnamurthy, A. (2008), “Collective risk management in a flight to quality episode”, Journal of Finance 63(5), 2195-2230.
- Crockett, A. (2007), “The Evolution and Regulation of Hedge Funds”, in: Banque de France (ed.) Financial Stability Review – Special Issue on Hedge Funds, April 2007, 19 – 28. At http://www.banque-france.fr/gb/ publications/rsf/rsf_042007.htm
- Diamond, D. and P. Dybvig, (1983), “Bank Runs, Deposit Insurance, and Liquidity”, Journal of Political Economy, 91-5, 401-419
- Diamond, D. W. and Rajan, R. G. (2005), “Liquidity shortage and banking crisis”, Journal of Finance 60(2), 615–647.
- Dodd, R. (2007), “Subprime: Tentacles of a Crisis”, Finance and Development 44, Nr. 4, 15 – 19. At http://www.imf.org/external/pubs /ft/fandd/2007/12/dodd.htm
- Dodd, R., and P. Mills (2008), “Outbreak: U.S. Subprime Contagion”, Finance and Development 45, Nr. 2, 14 – 18,. At http://www.imf.org/external/pubs /ft/fandd/2008/06/dodd.htm
- Duffie, D. (2007), “Innovations in Credit Risk Transfer: Implications for Financial Stability mimeo”, Stanford University, Stanford, CA. At http://www.stanford. edu/~duffie/BIS.pdf
- Duffie, D. (2008), “Innovations in credit risk transfer: Implications for financial stability”, BIS Working Paper 255, At <http://www.bis.org/publ /work255.pdf>.
- Gorton, G. (2008), “The Panic of 2007”, Federal Reserve Bank of Kansas City Symposium. At <http://www.kc.frb.org/publicat/ sympos/2008/Gorton.10.04.08.pdf>.
- Gorton, G. , “The Panic of 2007”, Proceedings of the 2008 Jackson Hole Conference, “Maintaining Stability in a Changing Financial System”, Federal Reserve Bank of Kansas City, 2008a, http://papers.ssrn.com /sol3/papers.cfm?abstract_ id=1255362 .
- He, Z. and Krishnamurthy, A. (2008), “Intermediated asset prices”, Working Paper, Northwestern University, At <http://www.kellogg.northwestern .edu/faculty/krisharvind/htm/work.html
- International Monetary Fund (2008 a), Containing Systemic Risks and Restoring Financial Soundness, Global Financial Stability Report, April 2008.
- International Monetary Fund (2008 b), Financial Stress and Deleveraging: Macro Financial Implications and Policy, Global Financial Stability Report, October 2008.
- International Monetary Fund (2008), Global Financial Stability Report. April.
- International Monetary Fund (2008), World Economic Outlook, Fall.
- International Monetary Fund (2009), Global Financial Stability Market update, July.
- International Monetary Fund (2009), Global Financial Stability Report. June and October.
- Kendra, K., Fitch (2007), “Tranche ABX and Basis Risk in Subprime RMBS Structured Portfolios”. At http://www.fitchratings.com/ web_content/sectors/subprime/Basis_in_ABX_ TABX_ Bespoke_SF_CDOs.ppt
- Keys, B. J., Mukherjee, T. K., Seru, A. & Vig, V. (2008), “Did securitization lead to lax screening? Evidence from subprime loans”, Working Paper.
- Khandani, A. E. and Lo, A. W. (2007), “What happened to the quants in august 2007?”, Journal of Investment Management 5, 5-54.
- Knight. M. (2008), “Some Reflections on the Future of the Originate-to-Distribute Model in the Context of the Current Financial Turmoil”, speech at the Euro 50 Group Roundtable, London, April 21. At http://www.bis.org/speeches /sp080423.htm
- Naimy V. (2009), “Liquidity Planning Between Theory and Practice: An Overall Examination of the GCC Banks During the Crisis Du Jour”, The Journal of Business Case Studies, Volume 5, Number 6.
- Naimy V. (2008), “How much High is Really High: Probability Analysis For oil prices and Economic Performance”. The Journal of American Academy of Business, Cambridge, Vol.13. Number 2, pp.71-76.
- Naimy, V. (1999), “Securitization Manuel”, Société Générale Libano-Européene de Banque.
- UBS (2008), Shareholder Report on UBS’s Writedowns. At http://www.ubs.com/1/e/investors /shareholderreport/remediation.html
- UBS, “Mortgage Strategist”, various issues: June 26, 2007, July 31, 2007, November 27, 2007, October 23, 2007, December 11, 2007.
- Wellink, N. (2007), “Risk Management and Financial Stability-Basel II and Beyond”, Speech at the GARP 2007 8th Annual Risk Management Convention and Exhibition, February 27, 2007. At http://www.bis.org/review /r070228a.pdf?noframes=1
[1]- Specifically, intergovernmental organizations, also known as international governmental organizations (IGOs). This type of organizations is most closely associated with the term “international organization”, and is made up primarily of sovereign states (referred to as member states). Notable examples include the United Nations (UN), European Union (EU; which is a prime example of a supranational organization), and World Trade Organization (WTO). The UN has used the term "intergovernmental organization" instead of "international organization" for clarity.
[2]- The International Monetary Fund (IMF) is an international organization that oversees the global financial system by following the macroeconomics policies of its member countries, in particular those with an impact on exchange rates and the balance of payments. It is an organization formed with a stated objective of stabilizing international exchange rates and facilitating development. It also offers highly leveraged loans mainly to poorer countries.
[3]- Most investment projects and mortgages have maturities measured in years or even decades. In the traditional banking model, commercial banks financed these loans with deposits that could be withdrawn at short notice. The same maturity mismatch was transferred to a -shadow banking system consisting of off-balance-sheet investment vehicles and conduits. These structured investment vehicles raise funds by selling short-term asset-backed commercial paper with an average maturity of 90 days and medium-term notes with an average maturity of just over one year, primarily to money market funds. The short-term assets are called -asset backed because they are backed by a pool of mortgages or other loans as collateral. In the case of default, owners of the asset-backed commercial paper have the power to seize and sell the underlying collateral assets.
[4]- In repurchase agreements, repo contract, a firm borrows funds by selling a collateral asset today and promising to repurchase it at a later date. This greater reliance on overnight financing required investment banks to roll over a large part of their funding on a daily basis.
[5]- Each ABX index is based on a basket of 20 credit default swaps referencing asset-backed securities containing subprime mortgages of different ratings. An investor seeking to insure against the default of the underlying securities pays a periodic fee (spread) which – at initiation of the series – is set to guarantee an index price of 100. It base value initiated in January 2007 is 100. When purchasing the default insurance after initiation, the protection buyer has to pay an upfront fee of (100 – ABX price). As the price of the ABX drops, the upfront fee rises and previous sellers of Credit Default Swaps suffer losses.
[6]- € 95 billion in overnight credit were injected inside the interbank market.
[7]- $ 24 billion were injected at that time.
[8]- This implies that for U.S. and European banks taken together such an amount in new capital is necessary just to prevent their capital position from deteriorating further.
[9]- The term “subprime” is not official designation of any regulatory authority or rating agency. Basically, the term refer to borrowers who are perceived to be riskier than the average borrower because of a poor credit history.
[10]- “Alt-A” are closely related categories of “subprime”.
[11]- Source: Federal Reserve Board, Inside MBS&ABS, Loan Performance, UBS.
[12]- This does not mean that the borrower receives a long-term mortgage.
[13]- Special purpose vehicles that issue long-dated liabilities in the form of rated tranches in the capital markets and use the proceeds to purchase structured products for assets (see details and specificities below). In particular, ABS (asset-backed securities, including mortgage-backed securities) CDOs purchased significant amounts of subprime RMBS bonds.
[14]- Chapter 1, p.11, October 2007.
[15]- Or may be consolidated for some purposes but not others.
[16]- A “qualifying” SPV (QSPV) is an SPV that meets the requirements set forth in Financial Accounting Standard (FAS 140):
(1) is “demonstrably distinct” from the sponsor;
(2) is significantly limited in its permitted activities, and these activities are entirely specified by the legal documents defining its existence;
(3) holds only “passive” receivables, that is there are no decisions to be made; and
(4) has the right, if any, to sell or otherwise dispose of non-cash receivables only in “automatic response” to the occurrence of certain events.
The term “demonstrably distinct,” means that the sponsor cannot have the ability to unilaterally dissolve the SPV, and that at least ten percent of the fair value (of its beneficial interests) must be held by unrelated third parties.
[17]- The sponsor cannot retain effective control over the transferred assets through an ability to unilaterally cause the SPV to return specific assets.
[18]- Unlike insurance companies which are active in many business lines, monoline insurers focused completely on one product, insuring municipal bonds against default (in order to guarantee a AAA-rating). More recently, however, the thinly capitalized monoline insurers had also extended guarantees to mortgage-backed securities and other structured finance products.
[19]- Since receivable payments are “principal” payments after a certain date.
[20]- Time tranching in subprime transactions is contingent on these triggers.
[21]- This means that the collateral balance exceeds the bond balance.
[22]- The CDS was popularized by J.P. Morgan. In its simplest form, a CDS is just a bet on an outcome. For example, say Bank A writes a million-dollar mortgage to Mr. X for a house. Bank A wants to hedge its mortgage risk in case X can’t make his monthly payments, so it buys CDS protection from Bank B, wherein it agrees to pay Bank B a premium of $1,000 a month for five years. In return, Bank B agrees to pay Bank A the full million-dollar value of X’s mortgage if he defaults. In theory, Bank A is covered if X goes into bankruptcy.
Estimates of the gross notional amount of outstanding credit default swaps in 2007 range from $45 trillion to $62 trillion.
One can directly trade indices that consist of portfolios of credit default swaps, such as the CDX in the United States or iTraxx in Europe. Anyone who purchased a AAA-rated tranche of a collateralized debt obligation, combined with a credit default swap, had reason to believe that the investment had low risk, because the probability of the CDS counterparty defaulting was considered to be small.
[23]- Example: Suppose a bank that:
borrows at LIBOR + 5 and
buys a AAA-rated CDO tranche which pays LIBOR + 30.
At the same time, buys protection for 15 basis points.
Therefore, the bank makes 25 bps over LIBOR net on the asset (30-5), and 10 bps profit after considering the 15bps as costs for protection.
[24]- Or via an index linked to a basket of such bonds. Dealer banks launched the ABX.HE (ABX) index in January 2006. This Index is a credit derivative that reflects the performance of 20 equally-weighted RMBS tranches. There are also indices comprising sub-indices linked to a basket of subprime bonds with specific ratings: AAA, AA, A BBB and BBB- . Each sub-index references 20 subprime RMBS bonds with the rating level of the subindex. Every six months the indices are reconstituted based on a pre-identified set of rules.
[25]- Office of Federal Housing Enterprise Oversight (OFHEO). See www.ofheo.gov/HPLasp .
[26]- For example, the off-balance sheet asset value of Citigroup in 2006 was $2.1 trillion compared with only $1.8 trillion value of assets!
[27]- Selling prices were below the expected present value of the payments on that asset.
[28]- The place where these institutions borrow and lend to each other.
[29]- The probability that a bank borrowing from another bank may not be able to repay has drastically increased.
[30]- France has committed to spend up to 40 billion euros, Germany up to 80 billion euros, the United Kingdom, 50 billion pounds.
[31]- The TARP has been changed twice in the US.
[32]- On interest payments by firms.
[33]- Mortgage interest payments by households.
[34]- The difficulty is clearly in the details of the design and the choice of the index.
أهمية فهم الأزمة المالية 2007 – 2008: وقائع واقتراحات.
فهم الأزمة المالية أمر أساس لتجنب تردّد أزمة أخرى بهذا الحجم ولإعادة التوازن وبناء نظام اقتصادي ومالي قوي وثابت.
يهدف هذا البحث إلى شرح موجز لأبرز الأحداث التي أدّت إلى الأزمة العالمية خلال العامين 2007 – 2008 وذلك من خلال عرض أبرز الأسباب التي أدّت إلى وقوع هذه المشكلة.
تعرض الباحثة تفاصيل الأسباب وتفسير الأحداث التي أدت إلى الخسائر في قطاع البناء وتردادها إلى القطاعات المالية.
وتقترح كحل مناسب اعتماد بعض السياسات لتجنب تكرار أزمة أخرى والوقوع بمشكلة مشابهة بهذا الحجم.


